
Finance: Gant Chart
Description
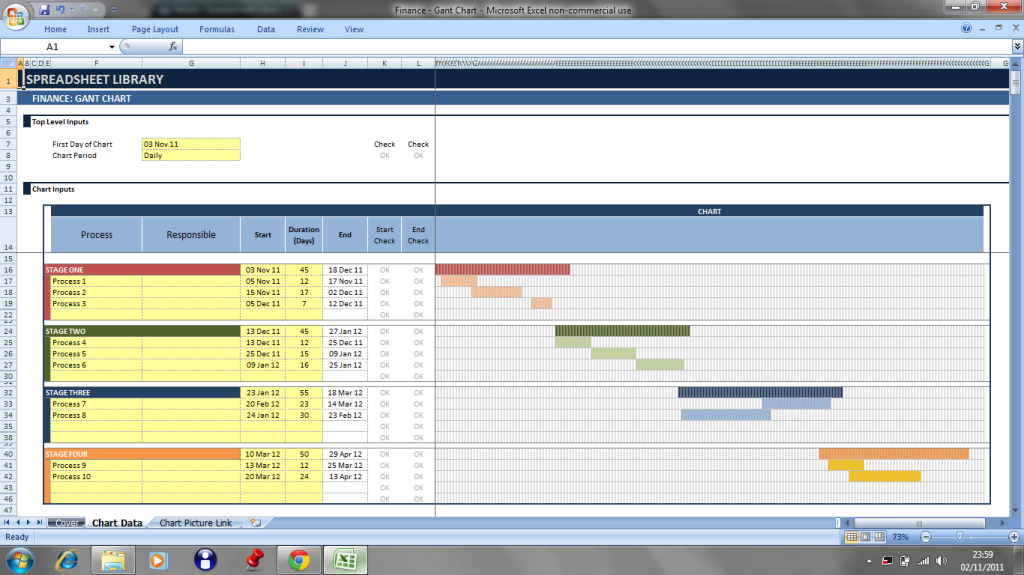
Gant Charts are a great way of creating an overview of a project timeline and understanding how different stages fit together.
Obviously professional bespoke Gant Chart software is available, but for ad hoc use our Finance: Gant Chart tool provides a perfectly functional, well presented and free alternative.
It has the scope for four main stages, with six processes in each. The period of the chart is also flexible and can be set as either Daily, Weekly or Annual.
Simply enter the start dates and durations of each stage and process and the tool will generate the gant chart.
Please watch the instructional video at the bottom of the page for a demonstration of the features and functionality of this tool.
Screenshots
To appreciate them fully, we recommend viewing the screenshots in full screen mode.
Download Blank User Version
NB: Will not work on versions pre Excel 2007
Finance - Gant Chart v0.01.xlsx
Microsoft Excel sheet [254.2 KB]
Download Instructional Video
Flash format
Finance - Gant Chart Video 1.swf
swf File [4.7 MB]
Download Pre Populated Example
NB: Will not work on versions pre Excel 2007
Finance - Gant Chart (Example) v0.01.xls[...]
Microsoft Excel sheet [260.8 KB]
